Make accessing your
apps delightful
Any user. Any experience. One platform.

The easy button for simple to sophisticated
Ping makes best-in-class user registration, onboarding, sign-in, profile management, account recovery, and anything identity easy:
Flow templates for best-in-class IAM
Drag & drop integrations
Optimize with A/B testing
Go fast with Implementation accelerators
Together at last
The Ping Identity Platform is your one-stop shop for managing identities, access, and governance. Extraordinary experiences. Uncompromising security.
Make your technology stack work for your business
The Ping Identity Platform makes plugging identity into your existing ecosystem and achieving your preferred architecture a breeze.
Why Organizations Choose Ping Identity
Analyst Leadership
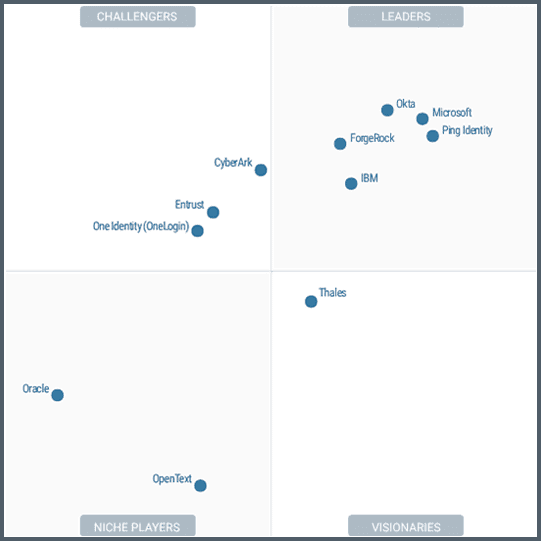
Gartner Magic Quadrant for Access Management, 2023
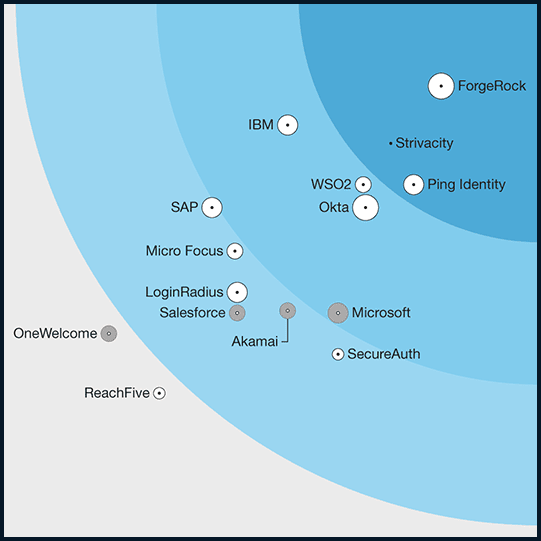
Forrester Wave™ Customer Identity and Access Management, 2022
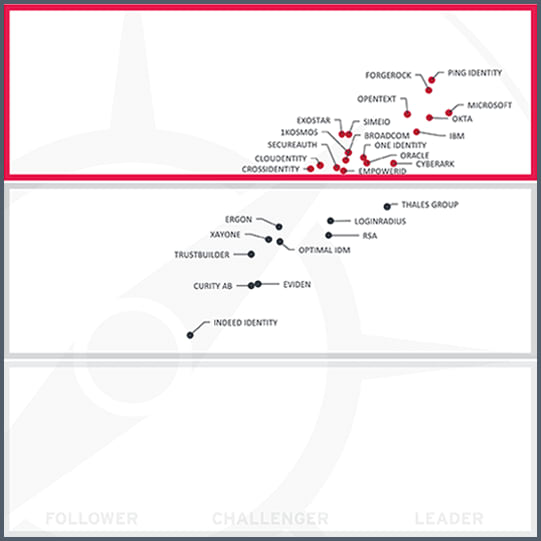
KuppingerCole Leadership Compass, Access Management, 2023
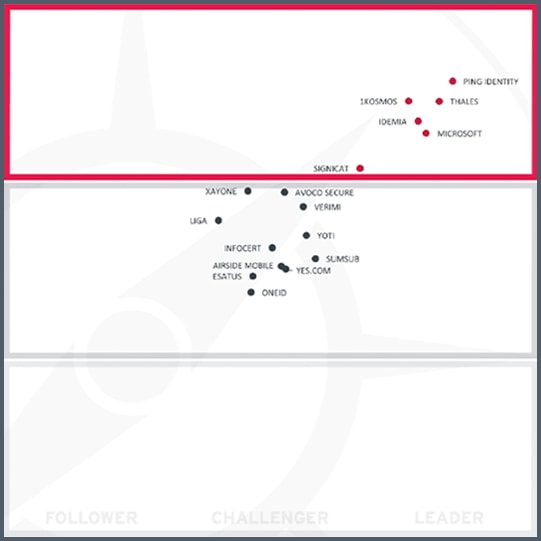
KuppingerCole Leadership Compass: Identity Fabrics, 2024
PingOne Protect is Here
>80%
of breaches start with compromised credentials. Detect bots and bad actors to prevent threats for smart authentication decisions

Build a Foundation of Identity
Just getting started with identity and access management? Here’s what you need first:
Differentiate With Innovation
Outpace your competitors and delight your users with innovative identity services that differentiate your business:
Start Today
See how Ping can help you deliver secure employee and customer experiences in a rapidly evolving digital world.